Complete CI/CD Pipeline Monitoring Platform.
Speed. Reliability. Confidence.
Developers shouldn't wait 15 minutes for builds while delivery velocity suffers. Cimatic CI Vitals provide engineering teams with the pipeline observability and DevOps performance metrics needed to optimize productivity and accelerate release cycles. Our CI/CD analytics platform helps teams understand how their GitHub Actions workflows perform.
Tired of CI/CD Tools That Don't Give You Insights?
Developers lose 2-4 hours per week to CI/CD friction. That's 20% of your productive time vanishing into slow builds, flaky tests, and infrastructure hiccups. You hit "re-run" on GitHub Actions, wait 10 minutes (hello, context switch!), and hope *this time* it works.
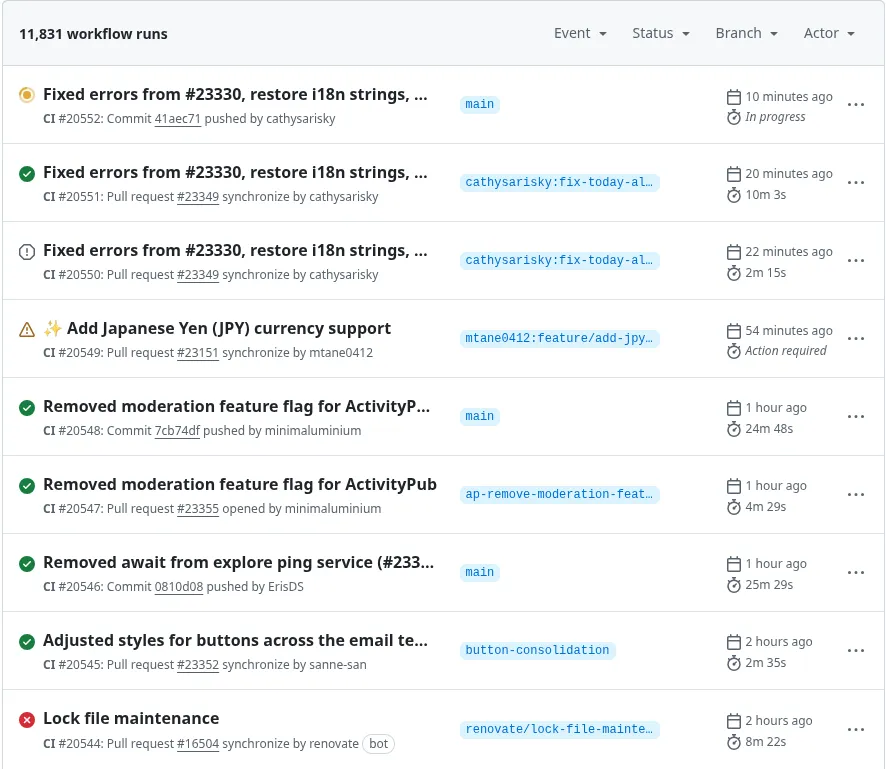
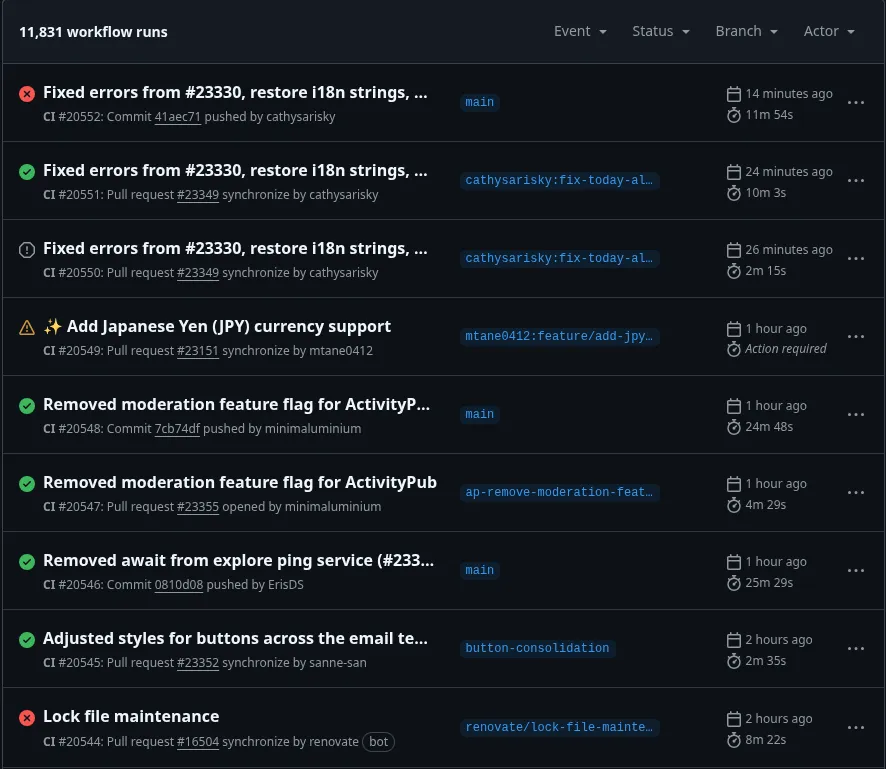
The green checkmark lies to you. It says "success" but hides the real story: Was this build fast or painfully slow? Understanding what is CI and CD performance means going beyond pass/fail status. Engineering teams need visibility into the *real* health of their CI/CD pipelines through comprehensive pipeline analytics tools and DevOps performance metrics.
Meet the Cimatic Vitals
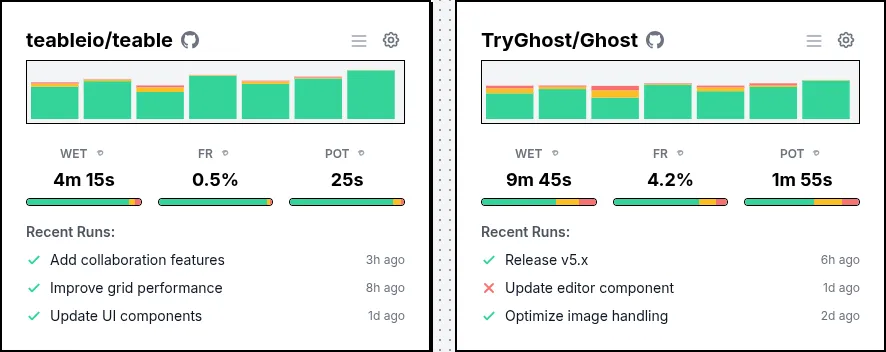
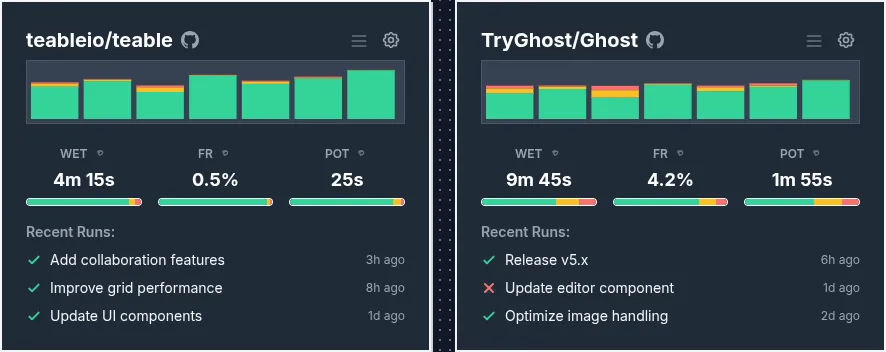
Three metrics. Complete observability for your CI/CD pipelines.
WET
Workflow Execution Time
"Speed matters, even with AI thinking"
How fast is your feedback loop? Measures end-to-end duration including AI reasoning time.
NFR
Noise-to-Fix Ratio
"Trust your automation—or fix it"
How reliable is your pipeline? Measures failures, rejected outputs, and rollbacks.
POT
Pipeline Overhead Time
"Don't let infrastructure waste your time"
How much time is wasted? Tracks queue waits, setup, and agent initialization.
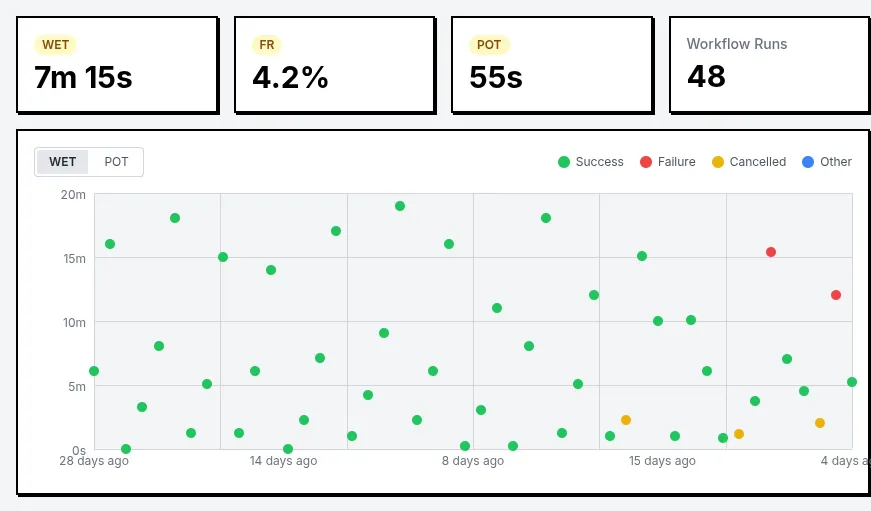
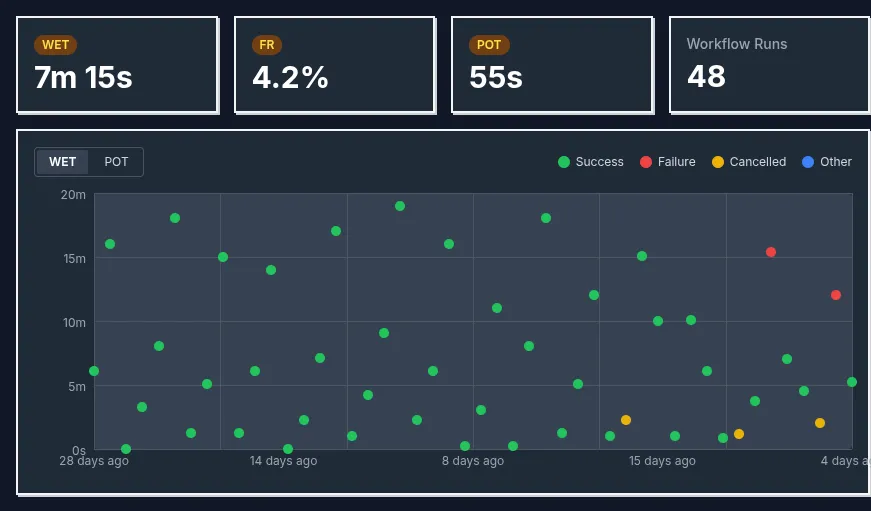
Cimatic: Your Complete GitHub Actions Analytics Dashboard
→Clear CI Metrics Dashboard: Instantly see WET, NFR, and POT for your key GitHub Actions workflows.
→Historical Trends Analysis: Understand how DevOps performance metrics change over time with our CI/CD analytics.
→Actionable Insights: Drill down to identify bottlenecks, common failures, and POT drivers in your CI/CD pipeline.
→Zero Configuration GitHub Actions Analytics: Connect your repo and analyze GitHub workflows immediately, including historical data.
Stop building complex CI/CD monitoring platform solutions. Start optimizing your GitHub Actions pipelines with our pipeline analytics tools.
Dive Deeper with Actionable Insights
Unlike other CI/CD pipeline tools, our pipeline analytics tools don't just show you numbers; they help DevOps teams understand what's happening in their GitHub Actions workflows. Pinpoint specific runs causing slowdowns and analyze individual job performance to find optimization opportunities with comprehensive CI/CD analytics.
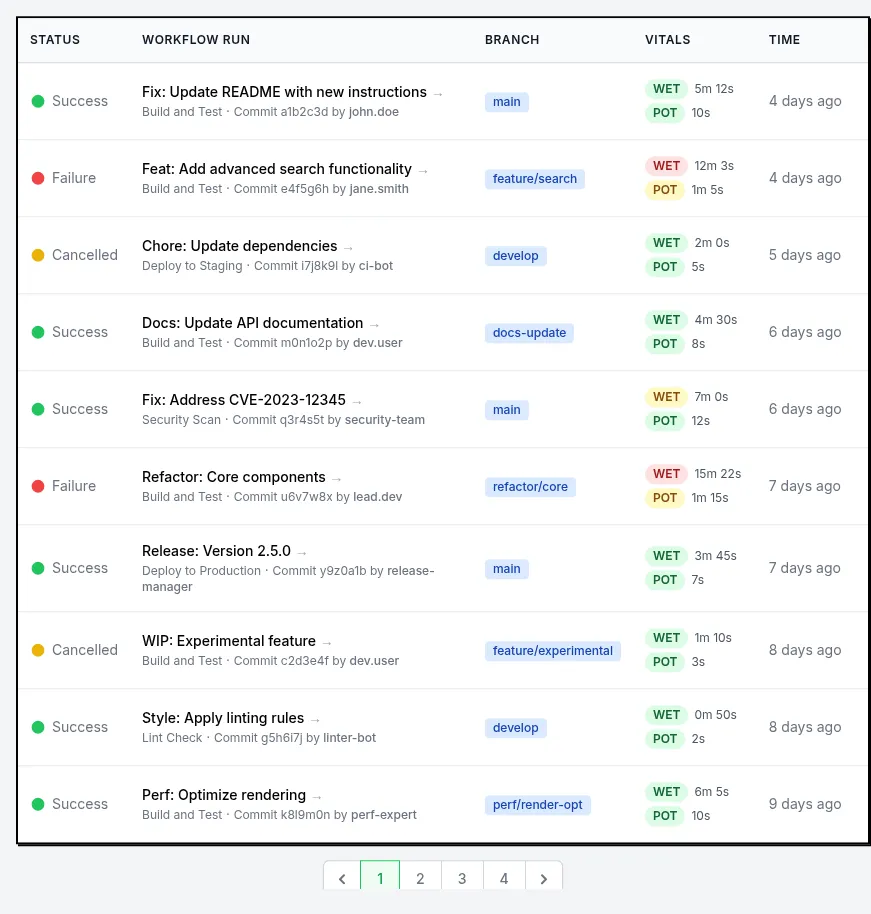
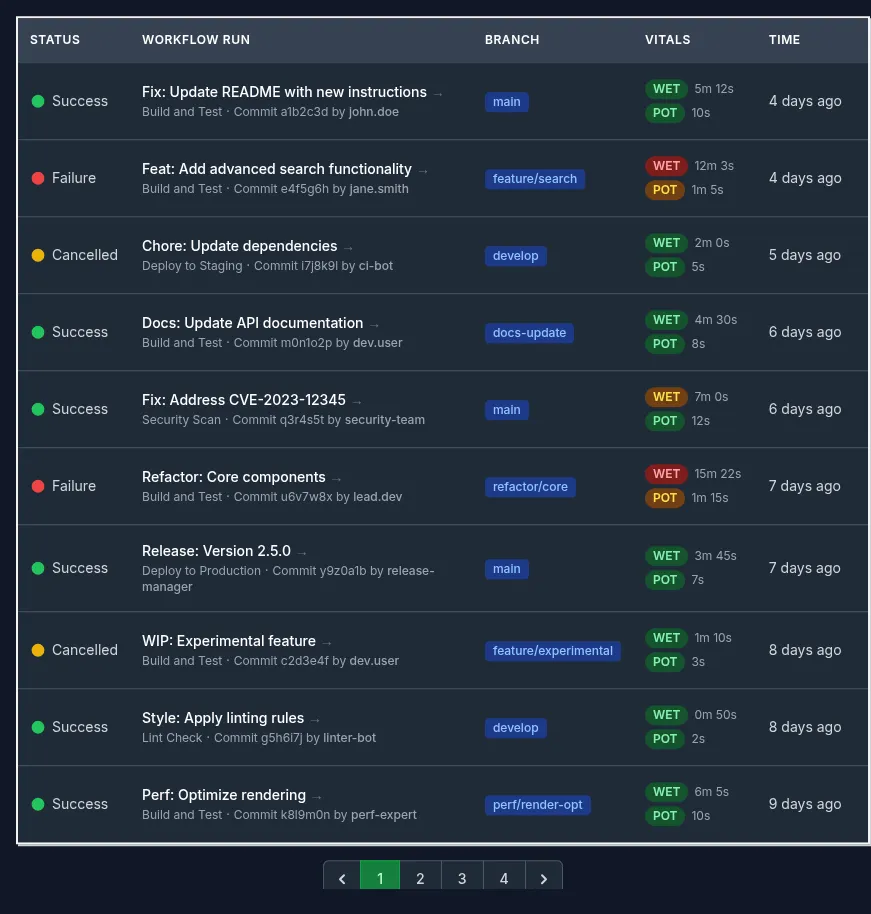
Analyze GitHub Actions Workflow History with CI/CD Analytics
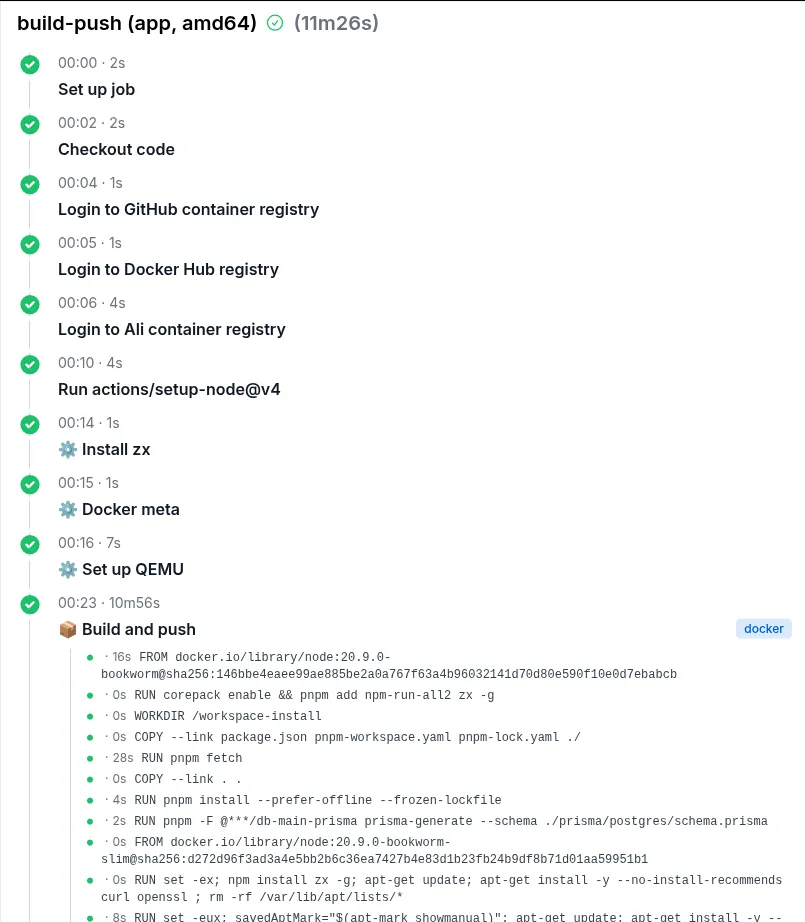
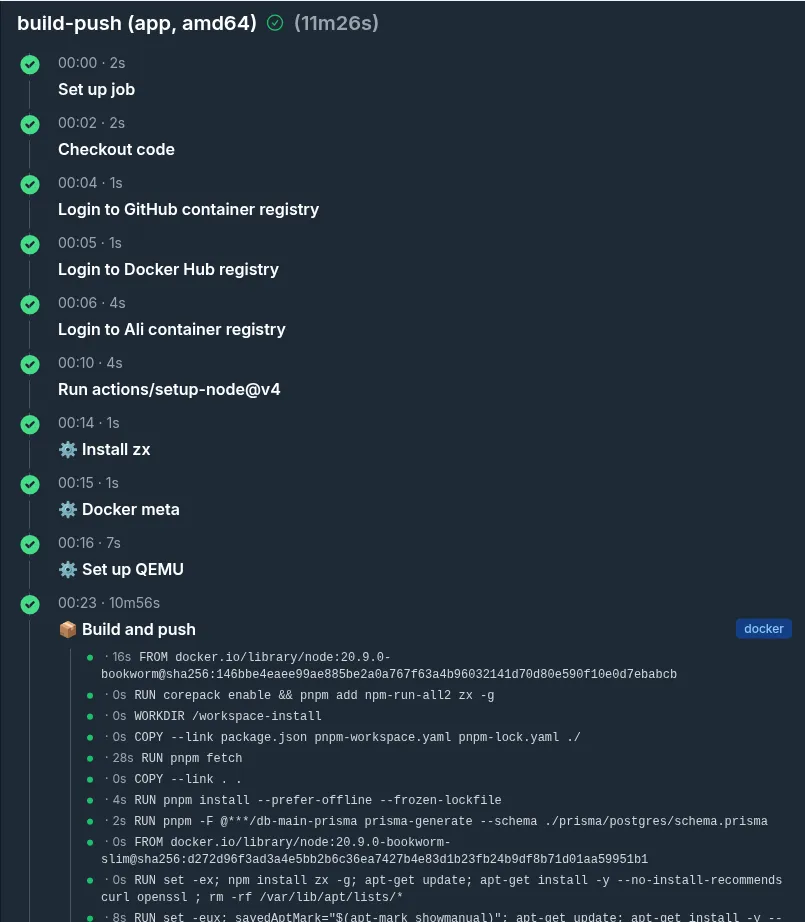
Drill Down into Job Performance Metrics
Stop Guessing. Start Measuring.
You can't improve what you don't measure. Join the waitlist for early access to our CI/CD monitoring platform and see your CI Vitals instantly — no setup, no configuration, just insights.
We respect your privacy. No spam, just updates on Cimatic.
Learn More About CI/CD Pipeline Architecture
📚 Complete Guide to CI/CD Pipeline Architecture
Dive deep into our systematic CI/CD Pipeline Architecture Framework. Learn how to combine Golden Path workflows with Pipeline Pillars to build enterprise-grade continuous integration and delivery systems.
Read the Complete Guide